
Monitoring allows developers to see various metrics of a system both in real-time and in retrospect to help with decision-making during maintenance and outage handling. It also represents the overall health of the system. Therefore, it's very important for an org to have a stable monitoring system in place.
InMobi Affiliate Platform (IAP) has multiple components to support the business and product at a high scale including HTTP-based services, event-driven systems, etc. To have the system up and running and operate on a such large scale, it’s important to monitor the system health, analyze the traffic pattern for better system optimizations and identify and act on any untoward incident and mitigate it.
Therefore, IAP relies on Prometheus as a monitoring system to monitor and understand the performance of its applications and infrastructure.
Prometheus is an open-source monitoring system that has its own built-in Time Series Database (TSDB) that scales well allowing it to collect metrics from thousands of endpoints. It supports powerful query language PromQL and various integrations with other systems.
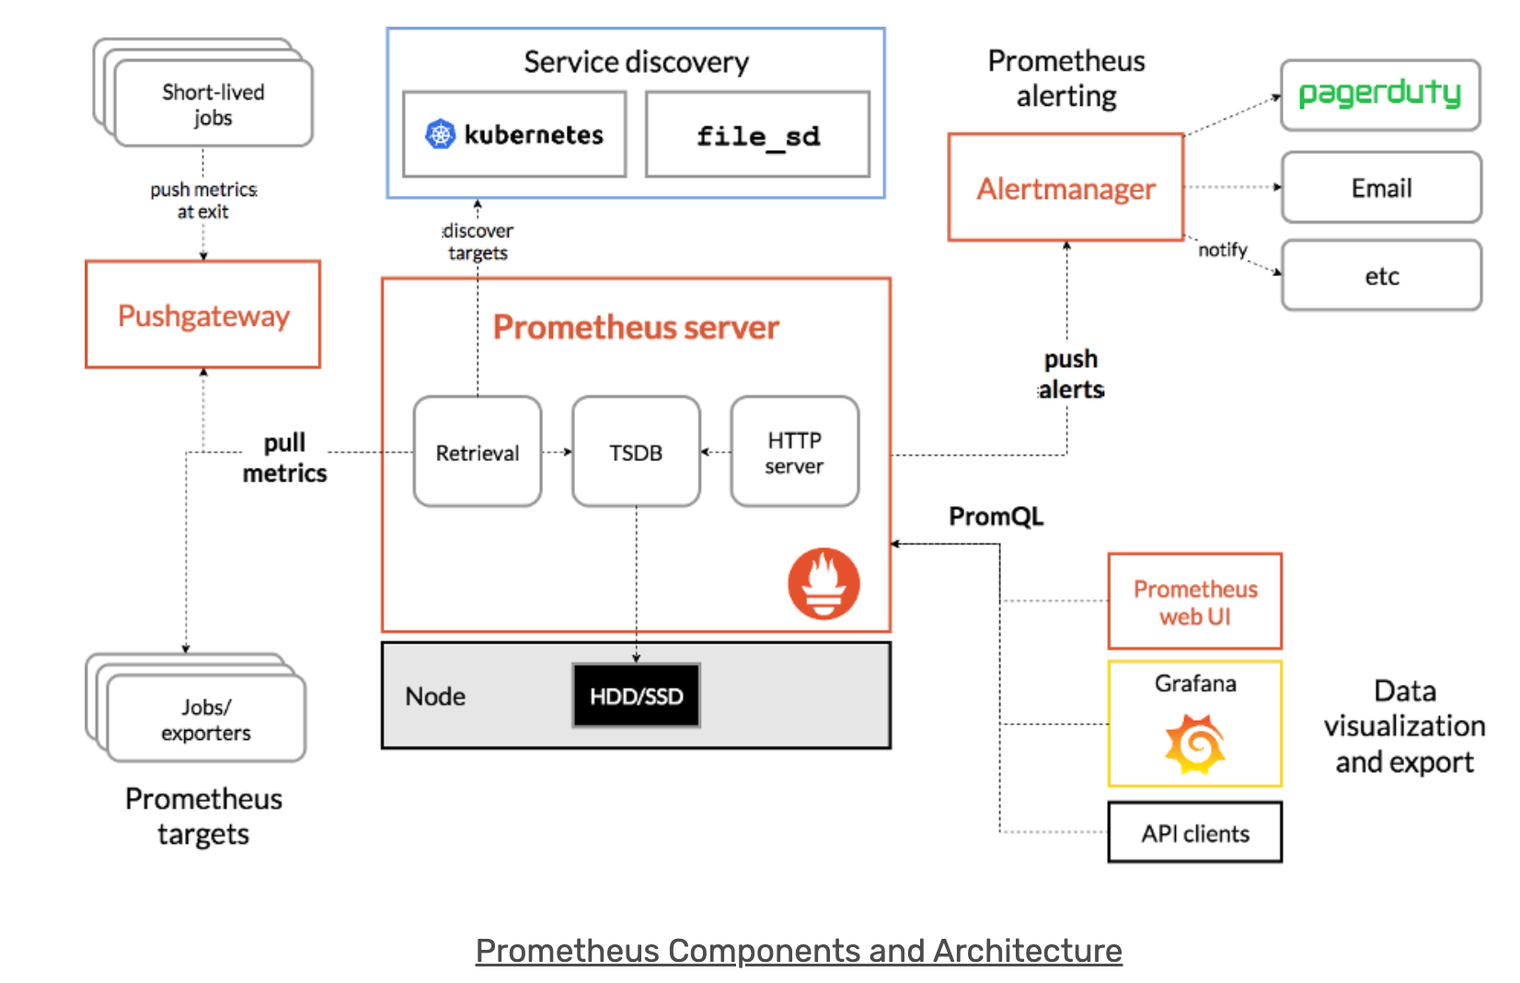
To better understand how Prometheus works, the Prometheus documentation provides this graphic and details about the essential elements of Prometheus and how the pieces connect together. You can refer to it and have a glance at its sub components.

Till now we discussed why monitoring systems are important and how Prometheus works in a nutshell. Let’s have a detailed look at how to monitor any Spring Boot application on Prometheus.
An application needs to expose all its metrics at an HTTP endpoint from which Prometheus can scrape it and in a data format that Prometheus can understand.
Spring Boot Actuator: Provides production-ready endpoints that you can use for your application. These endpoints fall under a common prefix of /actuator and are, by default, protected.
It provides the Prometheus metrics at /actuator/prometheus endpoint.
Micrometer: Micrometer converts and exposes Actuator metrics to external monitoring systems such as Prometheus.
It is a dimensional metrics and monitoring façade to help developers integrate their application metrics to various monitoring systems while keeping the application independent from the actual monitoring implementation.
This means that you as a developer can use a single interface to ship your metrics to a variety of monitoring systems. Concerning the scope of this blog, it's Prometheus.
Let’s take a look at the implementation level details of the setup required in Spring Boot Application and also some conventions and best practices for creating and naming metrics.
Dependencies required in the pom.xml:
Expose the actuator endpoint for Prometheus in application.properties:
management.endpoints.web.exposure.include=prometheus
Spring Boot autoconfigures a composite MeterRegistry and adds a registry to the composite for each of the supported implementations that it finds on the CLASSPATH. Having a dependency on micrometer-registry-{system} in your runtime CLASSPATH is enough for Spring Boot to configure the registry.
Spring Boot autoconfigures and registers some useful metrics for applications like JVM metrics, System Metrics, Logger Metrics, etc.
For more information check out Spring Boot Reference Documentation
application.properties file:management.metrics.enable.jvm=falseThis will disable the JVM related metrics for the application.
Micrometer employs a naming convention that separates lowercase words with a . (dot) character. Different monitoring systems follow different recommendations regarding naming convention, and some of them may be incompatible with one another. Each Micrometer implementation for a monitoring system comes with a naming convention that transforms lowercase dot notation names to the monitoring system’s recommended naming convention.
You can override the default naming convention for a registry by implementing NamingConvention and setting it on the registry:
registry.config().namingConvention(myCustomNamingConvention);
For example:
registry.timer("http.server.requests");
will translate to:
http_server_requests_duration_seconds in Prometheus.
By adhering to Micrometer’s lowercase dot notation convention, you guarantee the maximum degree of portability for your metric names across monitoring systems.
With the dotted.string.style of metrics it's usual to prefix metrics with the host they're on, environment, datacenter, application, and so on. This is however not the way to handle things in Prometheus whose labels provide a more powerful data model. In addition, Prometheus has a top-down way of handling service discovery.
Use labels to differentiate the characteristics that are being measured:
api_http_requests_total - differentiate request types: operation="create|update|delete"
api_request_duration_seconds - differentiate request stages: stage="extract|transform|load"
Do not put the label names in the metric name, as this introduces redundancy and will cause confusion if the respective labels are aggregated away.
Labels in Prometheus are arbitrary in nature and they can be much more powerful than just a service or instance that exposes a metric. With the simple example of http_requests_total, services can be more descriptive on the requests that are being counted and can expose elements like the endpoint being used or a status code returned.
# Number of unauthorised GET requests to the GET /users/:id endpoint of the Users Directory service
sum(http_requests_total{service="users-directory", method="GET", endpoint="/user/:id", status="403"})
Filtering based on labels
# Only consider the Users Directory service
http_requests_total{service="users-directory}"
# Filter out successful requests
http_requests_total{status!="200"}
# Matching `region` label with regular expression
failed_logins_attempts_total{region=~"us-west-.*"}
Aggregating labels
If the label is not specified, then the query will return as many time series as the number of combinations of labels and label values. To collapse them, an aggregator operator can be used in the query:
# Total number of requests regardless of any labels
sum(http_requests_total)
# Average memory usage for each service
avg(memory_used_bytes) by (service)
# Startup time of the oldest instance of each service in each datacenter
min(startup_time_milliseconds) by (service, datacenter)
You should follow the same lowercase dot notation described for meter names when naming tags.
Using this consistent naming convention for tags allows better translation into the respective monitoring system’s idiomatic naming schemes.
registry.counter("<metric-name>", "<tag-key>", "<tag-value>",...., "<tag-keyn>","<tag-valuen>")</tag-valuen></tag-keyn></tag-value></tag-key></metric-name>
is equivalent to:
registry.counter("<metric-name>", Arrays.asList(Tag.of("key1", "value1"),...., Tag.of("keyN", "valueN")))</metric-name>
For example, suppose that we are trying to measure the number of HTTP requests and the number of database calls, then the following is recommended:
registry.counter("database.calls", "db", "users")
registry.counter("http.requests", "uri", "/api/users")
This variant provides enough context so that, if only the name is selected, the value can be reasoned about and is at least potentially meaningful. For example if we select database.calls, we can see the total number of calls to all databases. Then we can group by or select by db to drill down further or perform comparative analysis on the contribution of calls to each database.
registry.counter("calls",
"class", "database",
"db", "users");
registry.counter("calls",
"class", "http",
"uri", "/api/users");
In this approach, if we select calls we get a value that is an aggregate of the number of calls to the database and to our API endpoint. This time series is not useful without further dimensional drill-down.
Prometheus will ignore the metrics having the same metric name but different dimensions as they fail it’s validation check, for example:
cache_errors{name=”cache_1”,type=”test”}
cache_errors{name=”cache_1”}
Out of the above two metrics, only the one that gets registered first will be emitted in Prometheus and all others bearing the same metric name cache_errors but different dimensions will not be emitted.
You can define common tags at the registry level and add them to every metric reported to the monitoring system. This is generally used for dimensional drill-down on the operating environment, such as host, instance, region, stack, and others.
In Spring Boot, this can be done in two different ways:
Add your common tags with configuration properties.
For example,
application.properties
management.metrics.tags.region=us-east-1<br />
management.metrics.tags.stack=prod<br />
management.metrics.tags.app=napp
If you need more flexibility (for example, you have to add common tags to a registry defined in a shared library), register a MeterRegistryCustomizer callback interface as a bean to add your common tags. See the Spring Boot Reference Documentation for more information.
Continuing on the above example, after the common tags are configured, all metrics will have these tags:
For registry.counter("request.received") metric, it will be translated to:
request_received_total{app="napp",region="us-east-1",stack="prod",}
Don't put the names of the labels in the metric name, such as http_server_requests_by_method_total. When the label is aggregated away, this will cause confusion.
Don't put the type of the metric in the name, such as gauge, counter, summary or map. This is already implied by the existing naming scheme, adds no information, and will cause confusion as you process and write rules based on the metrics.
Don't use colons in metric names. These are for the use of a person writing recording rules on the Prometheus server.
Prometheus favors snake case, avoid camelCase when creating your own metrics.
Micrometer provides the following set of Meters: Timer, Counter, Gauge, DistributionSummary, LongTaskTimer, FunctionCounter, FunctionTimer, and TimeGauge.
For the scope of this blog, we will only discuss about Timer, Counter and Gauges.
It is the most basic type of Meter, used to report a single count metric. It can only be incremented by a fixed positive number.
There are two possible ways to use counters :
Directly using Registry to implement the counter
meterRegistry.counter("
// Eg:
Counter counter1 = meterRegistry.counter("publisher.events", "type", "download"); // with tags
meterRegistry.counter("publisher.events"); //without tags
// to increment
counter1.increment() // will increment the counter by 1
counter1.increment(n) // will increment the counter by n
Using Counter Builder (which provides additional options like description)
Counter counter = Counter // 2nd Type
.builder("counter")
.baseUnit("beans") // optional
.description("a description of what this counter does") // optional
.tags("region", "test") // optional
.register(registry);
// Eg:
Counter counter = Counter // 2nd Type
.builder("publisher.events")
.baseUnit("event") // optional
.description("count of the events published") // optional
.tags("type", "download") // optional
.register(registry);
// to increment
counter.increment() // will increment the counter by 1
counter.increment(n) // will increment the counter by n
If you open the endpoint of the actuator Prometheus endpoint in your browser
For example, http://localhost:8080/actuator/prometheus
You will see something like the following (this is an example, the actual values will vary):
# HELP publisher_events_total
# TYPE publisher_events_total counter
publisher_events_total{type="download",} 5.0
It is used for measuring the time taken for certain events to happen (for example, method execution). Additionally, it also keeps a record of the frequency of these events.
The basic use of timers is to measure the latencies of execution or response.
We can use Timers in our code in the following ways:
Using Timer builder
Timer timer = Timer. // Using the builder
.builder("my.timer")
.publishPercentiles(0.50, 0.75, 0.90, 0.95, 0.98, 0.99, 0.999) // optional (supports multiple values)
.description("a description of what this timer does") // optional
.tags("region", "test") // optional
.register(registry);
timer.record(() -> dontCareAboutReturnValue());
timer.recordCallable(() -> returnValue())
// Eg:
Timer latency = Timer
.builder("eh_producer.send.requests")
.tags("eventhub", "s2s")
.publishPercentiles(0.50, 0.75, 0.90, 0.95, 0.98, 0.99, 0.999)
.description("Time to send batch of events to eh")
.register(meterRegistry);
latency.record(() -> {
try {
// processing logic
} catch (Exception e) {
log.error("Exception: ", e);
}
});
If you open the endpoint of the actuator Prometheus endpoint in your browser
For example, http://localhost:8080/actuator/prometheus
You will see something like the following (this is an example, the actual values will vary):
# HELP eh_producer_send_requests_seconds_max Time to send batch of events to eh
# TYPE eh_producer_send_requests_seconds_max gauge
eh_producer_send_requests_seconds_max{eventhub="s2s",} 0.0
# HELP eh_producer_send_requests_seconds Time to send batch of events to eh
# TYPE eh_producer_send_requests_seconds summary
eh_producer_send_requests_seconds{eventhub="s2s",quantile="0.5",} 0.0
eh_producer_send_requests_seconds{eventhub="s2s",quantile="0.75",} 0.0
eh_producer_send_requests_seconds{eventhub="s2s",quantile="0.9",} 0.0
eh_producer_send_requests_seconds{eventhub="s2s",quantile="0.95",} 0.0
eh_producer_send_requests_seconds{eventhub="s2s-retry",quantile="0.98",} 0.0
eh_producer_send_requests_seconds{eventhub="s2s-retry",quantile="0.99",} 0.0
eh_producer_send_requests_seconds{eventhub="s2s",quantile="0.999",} 0.0
eh_producer_send_requests_seconds_count{eventhub="s2s"} 0.0
eh_producer_send_requests_seconds_sum{eventhub="s2s"} 0.0
Using Timer Resource Sample (more convenient to use)
private Timer.ResourceSample getTimer(final meterRegistry, final String metricName, final Tags tags) {
return Timer.resource(meterRegistry, metricName) // using Timer Resource
.tags(tags)
.publishPercentiles(0.50, 0.75, 0.90, 0.95, 0.98, 0.99, 0.999);
}
try (Timer.ResourceSample sendTimer = getTimer(meterRegistry, "eh_producer.send.requests", Tags.of("eventhub", "eh1"))) {
try {
// processing logic
} catch (Exception e) {
log.error("Exception: ", e);
}
}
It is used to represent the current value of the state as a single numerical value.
As mentioned and recommended in the official Micrometer document as well:
Gauges should be sampled and not be set, so there is no information about what might have occurred between samples. Any intermediate values set on a gauge are lost by the time the gauge value is reported to a metrics backend, so there is little value in setting those intermediate values in the first place.
Basic uses of gauges is to measure the lags in consuming events from a message broker like EventHub, size of a collection, or number of threads in active state etc.
We can use Gauges in our code in the following ways:
Manually updating the gauge value (increment/decrement):
// maintain a reference to myGauge
AtomicInteger myGauge = registry.gauge("numberGauge", tags, new AtomicInteger(0));
// ... elsewhere you can update the value it holds using the object reference
myGauge.set(27);
myGauge.set(11);
// Eg:
AtomicLong lag = meterRegistry.gauge("ehconsumer_lag", "eventhub", "s2s", new AtomicLong(0));
lag.set(n);
java.lang.Number subtype that can be set, such as AtomicInteger and AtomicLong found in java.util.concurrent.atomic and similar types.If you open the endpoint of the actuator Prometheus endpoint in your browser
For example, http://localhost:8080/actuator/prometheus)
You will see something like the following (this is just an example, the actual value will vary):
# HELP ehconsumer_lag
# TYPE ehconsumer_lag gauge
ehconsumer_lag{eventhub="s2s",} 1.0
Passing a method to observe for change as a supplier
// Direcly using registry to build and monitor a gauge metric
List
// Using Gauge Builder
Gauge gauge = Gauge
.builder("gauge", myObj, myObj::gaugeValue)
.description("a description of what this gauge does") // optional
.tags("region", "test") // optional
.register(registry);
// Eg: Let say you want to monitor the size of the Map advInfoMap
Map
private Integer getRepoSize(){ // this method returns the size of advInfoMap
return advInfoMap.size();
}
Gauge.builder(metricName, this::getRepoSize)
.tags(tags)
.register(meterRegistry);
Target labels, not metric name prefixes – Robust Perception | Prometheus Monitoring Experts
https://promcon.io/2017-munich/slides/best-practices-and-beastly-pitfalls.pdf
On the naming of things – Robust Perception | Prometheus Monitoring Experts


Sign up with your email address to receive news and updates from InMobi Technology