

One of the greatest benefits of monitoring is to help observe your system with relevant metrics and take required action in case of issues.
We were rewriting some of our services using structured Spark streaming on Databricks. We needed a robust monitoring tool using which we could monitor the streaming jobs. These jobs also have multiple external dependencies that needs to be monitored. So, we needed a tool using which we could emit custom metrics along with system metrics to facilitate smooth running of our systems.
Apache Spark has a configurable metrics system to allow users to report Spark metrics to a variety of sinks. With launch of Spark 3.0, It added native support for Prometheus Integration. Prometheus is one of the popular open-source monitoring and alerting toolkits which is used with Apache Spark together.
By default, Databricks reports streaming metrics on Ganglia. But currently Ganglia doesn’t support custom metrics for monitoring. So, we integrated our stream job metrics with Prometheus.

Executors in streaming jobs can be allocated or deallocated as per usage. This may lead to metrics loss from executors before the endpoint is scrapped.
Due to security reason, internal calls were restricted to cluster driver node, which didn’t allow to scrape exposed metrics.
Whenever a cluster restarts the driver IP changes and presently, we can’t have static IP. So, on every restart, the Prometheus scrapping endpoint needs to change.
To overcome the above challenges, we decided to go with push-based mechanism instead of pull-based mechanism. This has solved all the above challenges. We achieved push-based mechanism using banzaicloud prometheus Sink. It pushes metrics to push gateway (Prometheus Sink). For this you need a push gateway setup.
# Enable Prometheus for all instances by class name
*.sink.prometheus.class=com.banzaicloud.spark.metrics.sink.PrometheusSink
# Prometheus pushgateway address
*.sink.prometheus.pushgateway-address-protocol=
*.sink.prometheus.pushgateway-address=
*.sink.prometheus.period=
*.sink.prometheus.unit=< unit> - defaults to seconds (TimeUnit.SECONDS)
*.sink.prometheus.pushgateway-enable-timestamp=
*.sink.prometheus.group-key=app_name=
The above metrics properties need to be updated at /databricks/spark/conf/metrics.properties.
To accomplish this, you will need to add an initialization script in Databricks. This script will be responsible for configuring the cluster during its creation process, instead of relying on the default configuration. This can be achieved by specifying the necessary configuration options in the initialization script, which will then be applied to the cluster at runtime.
@Slf4j
public class PrometheusSource implements Source {
private final MetricRegistry registry;
@Override
public String sourceName() {
return ConstantsWingman.STREAMING;
}
@Override
public MetricRegistry metricRegistry() {
return registry;
}
public PrometheusSource() {
registry = new MetricRegistry();
}
}
To asynchronously monitor all queries associated with a SparkSession, we attached a StreamingQueryListener to Spark stream.
spark.streams.addListener(new StreamingQueryListener() {
override def onQueryStarted(queryStarted: QueryStartedEvent): Unit = {
println("Query started: " + queryStarted.id)
}
override def onQueryTerminated(queryTerminated: QueryTerminatedEvent): Unit = {
println("Query terminated: " + queryTerminated.id)
}
override def onQueryProgress(queryProgress: QueryProgressEvent): Unit = {
println("Query made progress: " + queryProgress.progress)
}
})
println(query.lastProgress)
// Will print something like the following.
{
"id" : "ce011fdc-8762-4dcb-84eb-a77333e28109",
"runId" : "88e2ff94-ede0-45a8-b687-6316fbef529a",
"name" : "MyQuery",
"timestamp" : "2016-12-14T18:45:24.873Z",
"numInputRows" : 10,
"inputRowsPerSecond" : 120.0,
"processedRowsPerSecond" : 200.0,
"durationMs" : {
"triggerExecution" : 3,
"getOffset" : 2
},
"eventTime" : {
"watermark" : "2016-12-14T18:45:24.873Z"
},
"stateOperators" : [ ],
"sources" : [ {
"description" : "KafkaSource[Subscribe[topic-0]]",
"startOffset" : {
"topic-0" : {
"2" : 0,
"4" : 1,
"1" : 1,
"3" : 1,
"0" : 1
}
},
"endOffset" : {
"topic-0" : {
"2" : 0,
"4" : 115,
"1" : 134,
"3" : 21,
"0" : 534
}
},
"numInputRows" : 10,
"inputRowsPerSecond" : 120.0,
"processedRowsPerSecond" : 200.0
} ],
"sink" : {
"description" : "MemorySink"
}
}
This information is available under Spark UI → Structured Streaming.
To obtain metrics related to our streaming batch and integrate them with Prometheus, we developed a JSON parser within our application. This parser is responsible for extracting information from the aforementioned JSON schema, which is then used to generate metrics. These metrics are subsequently pushed to the push-gateway, allowing for seamless integration with Prometheus.
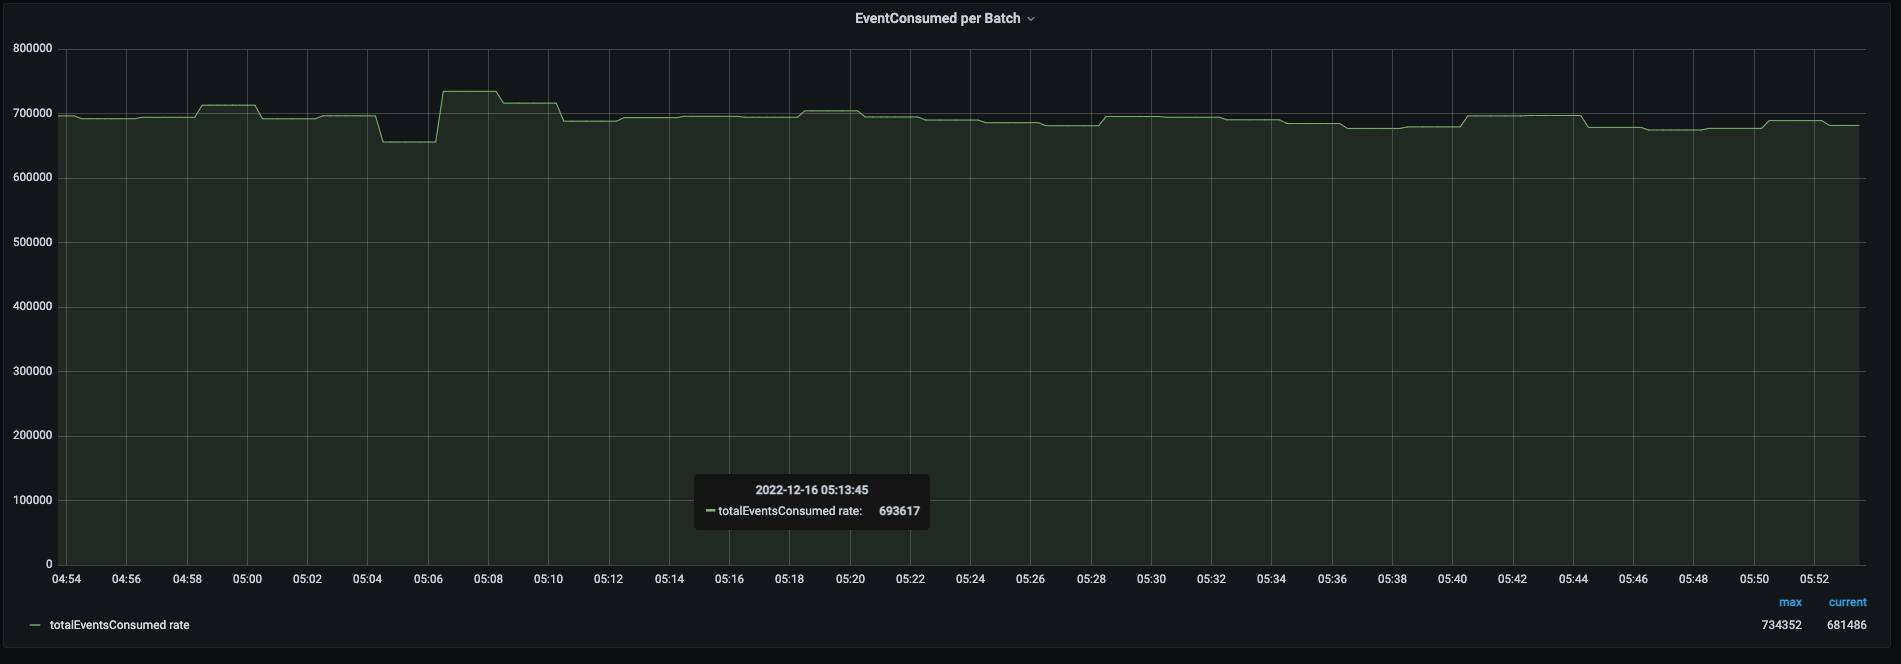
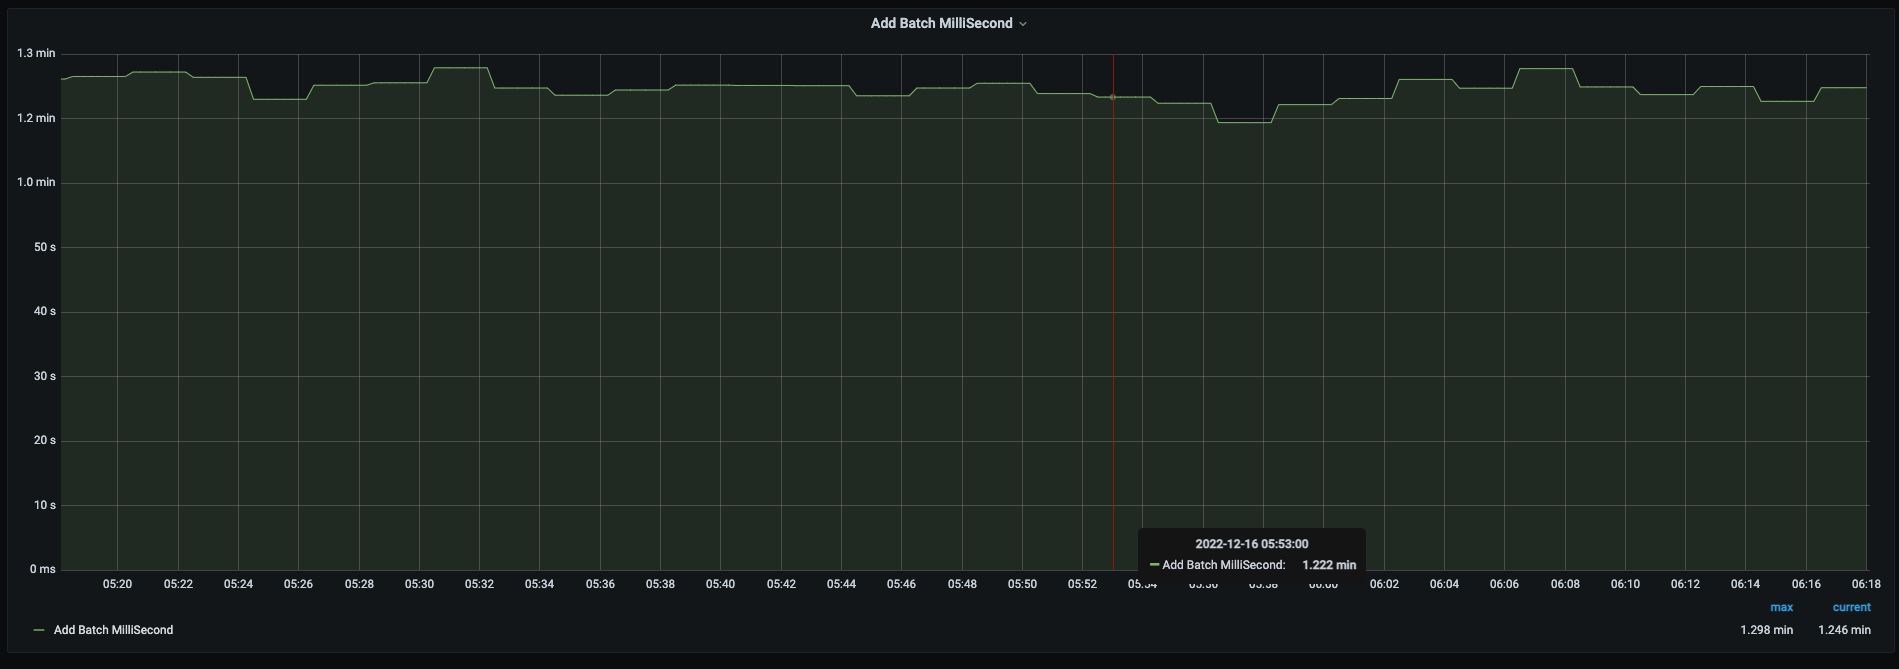

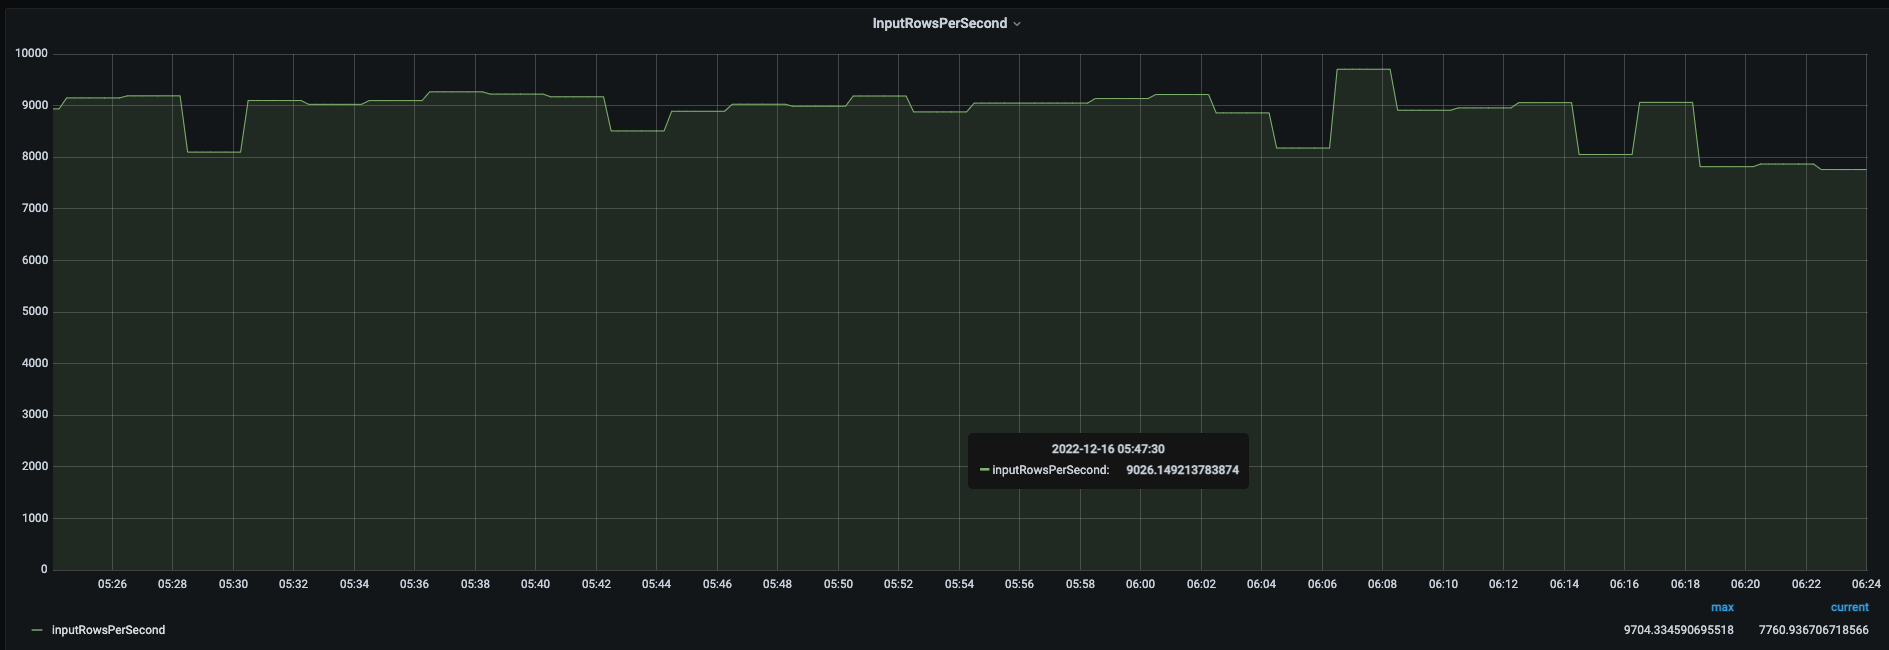
In a nutshell, this was how we experienced integrating Prometheus with our Spark Streaming jobs. Here we detailed out the challenges we encountered and how could we successfully overcome them. Eventually, this integration enabled us to monitor our system while maintaining uniformity and set up alerts to ensure that it functions properly.


Sign up with your email address to receive news and updates from InMobi Technology